

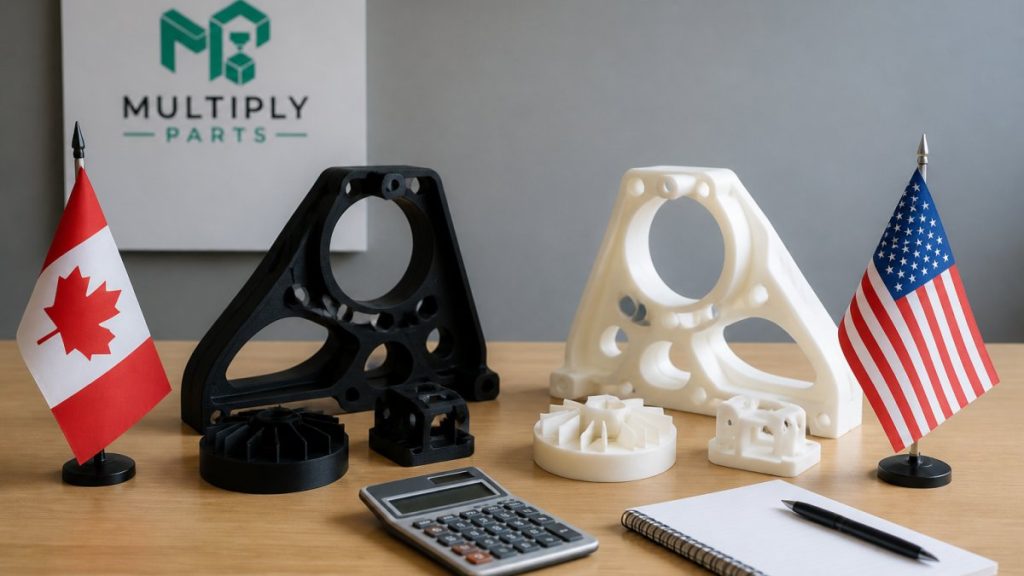
Canadian Manufacturing vs USA Cost Analysis 2026
Table of Contents
- What a 2026 Canadian Manufacturing vs USA Cost Analysis Must Include
- How to Use a Manufacturing Cost Comparison Template
- Manufacturing Labor Costs Canada vs. U.S. in 2026
- Canada U.S. Manufacturing Tariffs 2026: What Actually Applies
- 3D Printing vs. Injection Molding Cost for Short-Run Production
- Provincial and State-Level Cost Differences
- Tax Credits, Grants, and Incentives on Both Sides of the Border
- Scenario Planning for 2026: Policy and Exchange Rate Shocks
- Frequently Asked Questions
Last Updated: October 6, 2026
What a 2026 Canadian Manufacturing vs USA Cost Analysis Must Include
A Canadian manufacturing vs USA cost analysis 2026 compares what it actually costs to make a part on each side of the border, labor, energy, logistics, tariffs, and incentives.

Most analyses compare a Canadian wage to a U.S. wage and stop. What matters is cost per good part, the fully loaded number after benefits, productivity, freight, duty, and currency.
How to Use a Manufacturing Cost Comparison Template
A manufacturing cost comparison template works when it forces every cost into one of four buckets: per-unit variable cost, fixed setup cost, logistics cost, and one-time policy cost. Build it with one column per location and one row per line item.
Line Items That Belong in the Model
- Direct labor hours per unit and the loaded hourly rate (wage plus payroll taxes plus benefits)
- Machine time and energy per unit, priced at the local industrial rate
- Material cost including scrap rate and any cross-border freight on inputs
Worked Example: 10,000 EV Brackets per Year
Take a simple aluminum EV accessory bracket needing 0.4 hours of machine time, with one operator overseeing two machines and annual volume of 10,000 units.
Fixed costs dominate at low volume and variable costs at high volume. If molded tooling runs into five figures, amortized tooling is a meaningful chunk of per-part cost at 10,000 units and nearly disappears at 100,000.
| Line Item | Low Volume (1,000 units) | Mid Volume (10,000 units) | High Volume (100,000 units) |
|---|---|---|---|
| Tooling amortized per unit | High | Moderate | Low |
| Labor per unit | Stable | Stable | Stable |
| Material per unit | Stable | Slight discount | Volume discount |
| Logistics per unit | High | Moderate | Low |
| Best-fit process | 3D printing | 3D printing or bridge tooling | Injection molding |
Amortize tooling over the volume you will realistically order in 18 months, not the volume in your business plan. Most startups overestimate first-year demand, and an amortization built on optimistic numbers makes the wrong process look cheaper.
Manufacturing Labor Costs Canada vs. U.S. in 2026
Manufacturing labor costs Canada vs. U.S. come down to two numbers: the loaded hourly rate and output per hour. A lower wage with lower output can cost more per part than a higher wage with better automation.
Wage Rates, Benefits, and Payroll Burden
Canadian manufacturers carry employer CPP contributions and EI premiums. U.S. employers carry Social Security, Medicare, and state unemployment insurance, which varies widely by state. Health coverage is a larger U.S. line item because it is tied to employment, while Canadian coverage runs through provincial health systems funded by taxation.
Base wages can look similar, but the loaded rate diverges by location and benefits package. Get a loaded rate from your payroll provider, not a base rate.
Productivity and Output per Hour
Output per hour is where the comparison is won or lost. A shop running lights-out machining on nights and weekends produces far more per labor hour than a one-shift shop. Compare automation level, not just wage: if one facility needs three operators for a job another runs with one, the wage difference rarely closes that gap.
Canada U.S. Manufacturing Tariffs 2026: What Actually Applies
Canada U.S. manufacturing tariffs 2026 depend on where your goods originate, not where they ship from. Under CUSMA, most goods meeting the rules of origin move duty-free; goods that fail face the applicable most-favored-nation rate. That gap is often the largest line item in a location decision.
CUSMA Rules of Origin and Tariff Exposure
Rules of origin are the tariff question that matters most, and they are not a single test. Qualification usually turns on one of three mechanisms:
- Tariff shift. Non-originating inputs must undergo a change in tariff classification, a foreign component of one heading becomes a finished good of another. If met, the part can originate even with imported content.
- Regional value content (RVC). The good must contain a minimum share of North American content, calculated by the transaction-value or net-cost method. The threshold varies by product and method, so the same bill of materials can pass under one and fail under the other.
- Process rule. Certain goods qualify only if they are produced through a specified manufacturing process, regardless of content.
A part assembled in Canada from imported components may or may not qualify, depending on which test applies to its classification.
Check the Canada Border Services Agency guidance on CUSMA rules of origin before you model duty as zero. If you are the importer, the onus is on you to hold the supporting documentation, bills of materials, supplier certifications, and cost records, and to be able to produce it on request.
Total Landed Cost and Cross-Border Logistics
Total landed cost is the only number that matters at the loading dock: unit price, freight, brokerage, duty, insurance, and the carrying cost of customs delays.
A workable landed-cost formula looks like this:
Landed cost per unit = (unit price + inbound freight + brokerage + duty + insurance) ÷ units per shipment + carrying cost of transit inventory
The carrying cost is the line most teams forget. If a cross-border shipment adds two weeks of transit versus a domestic supplier, you finance that inventory for two extra weeks on every order, a real per-unit number that compounds with order frequency.
Three mechanisms change the math:
- Duty drawback and deferral programs. Duties paid on imported inputs can sometimes be recovered or deferred when goods are later exported (Trade incentives programs). These programs are administrative, not automatic, and require record-keeping many small manufacturers lack.
- De minimis thresholds. Low-value shipments may enter duty-free below a threshold, which matters for sample runs and spare parts but rarely for production volumes.
- Preferential vs. MFN rates. The duty-free outcome is conditional on origin. If your supplier cannot document origin, you pay the MFN rate even though the goods physically crossed a CUSMA border.
Do not model duty as zero just because your supplier is in a CUSMA country. Origin is determined by the goods, not the shipping address. A misclassified part can generate a customs adjustment plus penalties months after delivery, and the assessment can reach back across multiple shipments.
What This Means for a 2026 Location Decision
The tariff line is not static. Model two duty scenarios, preferential and MFN, and see whether your location decision survives both. If the project only clears in the preferential case, your exposure is concentrated in a single documentation failure or policy change. That is a risk you can price, but only if you have run the numbers both ways.
3D Printing vs. Injection Molding Cost for Short-Run Production
3D printing vs. injection molding cost is a volume question. Molding has high fixed tooling cost and very low per-unit cost; 3D printing has near-zero tooling cost and higher per-unit cost. The crossover point is where the two lines meet.
Tooling Investment and Break-Even Volumes
Break-even volume is where total costs are equal. Below it, 3D printing is cheaper because you skip the mold; above it, molding wins because tooling is spread across enough parts. The exact crossover depends on part size, material, and mold complexity, so run your own numbers rather than a rule of thumb.
When 3D Printing Wins on Total Cost
- Design is still changing. No tooling means no rework cost when the CAD file changes.
- Volume is uncertain. You can produce 50 units now and 500 later without committing to a mold.
- The part is complex. Internal channels and lattice structures cost nothing extra to print and are expensive to mold.
This is the case for a Canadian partner with no minimum order quantities. MultiplyParts quotes instantly and prints without tooling, so you can validate a design and scale without a re-tooling cycle. HitchStyle.com is one customer using that approach to move from concept to a sellable product.
Provincial and State-Level Cost Differences
Provincial and state-level differences often outweigh national averages. Industrial electricity rates, commercial property taxes, and incentive programs vary enough that two facilities in the same country can have very different cost structures. This is the layer most national analyses skip, and where a location decision is actually won or lost.
Industrial Electricity: The Province-by-Province Driver
Industrial power rates differ meaningfully by province, largely because of how each generates electricity. Provinces with abundant hydroelectric capacity tend to offer lower industrial rates, which matters most for energy-intensive processes, machining, heat treating, injection molding, and multi-shift operations.
Two identical facilities in the same country can carry very different energy bills per machine hour.
Property Taxes and Industrial Assessment
Commercial and industrial property taxes are set municipally and vary by assessment ratio and mill rate. A building of the same square footage and assessed value can carry a materially different annual tax bill depending on location. For a facility-heavy operation, this is a recurring fixed cost, so it belongs in the fixed-cost bucket of your model.
Labor Availability and the Supply-Base Effect
Labor availability is the other provincial variable, and often more decisive than wage rates.
A deep supply base means competitors have already trained the workforce you need, you inherit that training. A thin supply base means you pay to build it and absorb the productivity loss while new hires climb the learning curve.
How to Compare Two Locations Without a National Average
Build a location scorecard with the same line items for each candidate, weighted by how much each moves your cost per part:
- Industrial electricity rate (per kWh, quoted for the specific location)
- Property tax (annual, based on assessed value and mill rate)
- Loaded labor rate (wage plus statutory payroll costs plus benefits)
The scorecard is not about producing a single number. It forces every location onto the same basis so you can see which factor drives the ranking. Usually one or two line items dominate, and the rest are noise.
Run the scorecard twice: once with national average rates and once with quoted local rates. If the ranking flips between the two runs, your decision is sensitive to a number you have not yet confirmed, go get the quote before you commit.
Why This Layer Matters More in 2026
With trade policy and exchange rates both moving, the controllable part of your cost structure matters more. Provincial and state-level factors, power, property tax, labor depth, are the inputs you can verify and lock in. National averages are useful for a first-pass screen, but the decision tool is a quoted rate for a specific building in a specific location, run through the same model as every other candidate.
Tax Credits, Grants, and Incentives on Both Sides of the Border
Tax credits and grants can change the ranking of two locations that look identical on paper.
On the U.S. side, state and local governments compete for manufacturing investment with property tax abatements, job creation credits, and training grants.
Two rules for modeling incentives: count only what is confirmed in writing, and spread the credit over the period you actually earn it.
Incentives should be the last line in your model, never the reason for the decision. If a location only wins because of an incentive, you are exposed the moment the program changes.
Scenario Planning for 2026: Policy and Exchange Rate Shocks
Scenario planning protects a location decision from what you cannot control. Build three versions of your model: base case, tariff case, and currency case.
- Tariff case: assume the applicable duty rate rises and re-run total landed cost. If the decision flips, your exposure is real.
- Currency case: move the exchange rate by a meaningful band in both directions. A weaker Canadian dollar helps exporters and raises input costs for importers.
- Policy uncertainty case: assume a program you are counting on is delayed by a year and see whether the project still clears your hurdle rate.
The point is not to predict, but to know which assumption your decision is most sensitive to, so you can watch that one number instead of all of them.
Choosing where to manufacture in 2026 means choosing which risks you can live with.
Frequently Asked Questions
Are 40% of Canadian manufacturers moving to the US?
That figure overstates what survey data shows. Some Canadian manufacturers have announced US expansions, but most operate facilities on both sides of the border rather than relocating entirely. A 2026 Canadian manufacturing vs USA cost analysis should treat relocation as one option among several, alongside dual-sourcing, automation, and nearshoring within Canada. Decisions hinge on total landed cost, tariff exposure, and customer proximity, not headline percentages. For short-run and prototype work, staying with a Canadian partner often avoids cross-border friction and tooling duplication.
Is it cheaper to manufacture in Canada or the U.S. in 2026?
It depends on volume, product type, and where your customers are. US manufacturing often shows lower energy costs and, in some states, lower corporate tax rates. Canadian manufacturing frequently offers lower employer health benefit costs, a favourable exchange rate for US-dollar revenue, and access to CUSMA tariff-free trade. A manufacturing cost comparison template that models labor, energy, logistics, tariffs, and tooling side by side will show which location wins for your specific part. For runs under a few thousand units, 3D printing in Canada often beats both.
How do tariffs affect the cost of manufacturing in Canada versus the U.S.?
Under CUSMA, most goods that meet rules of origin move duty-free between the two countries. When origin rules are not met, or when new tariff measures apply, the effective tariff rate can add a meaningful percentage to landed cost. Canada U.S. manufacturing tariffs 2026 discussions focus on steel, aluminum, and certain finished goods. Build your model with a line for tariff exposure at the part level, and test scenarios where rates shift by 5, 10, or 15 percent to see how sensitive your margin is.
How do exchange rates affect Canadian and U.S. manufacturing costs?
A weaker Canadian dollar lowers the cost of Canadian production when your revenue is in US dollars, effectively cutting labor and overhead by the exchange differential. The reverse is true for Canadian buyers sourcing from US suppliers. Because rates move, run your manufacturing cost comparison template at three exchange rates, such as 1.30, 1.35, and 1.40 CAD per USD, and identify the break-even point where the US option becomes cheaper. This is standard practice in cross-border cost analysis.
